
If you want the world’s worst swear word, you’ll have to create it yourself. Here you go:
Click the Go button repeatedly and contemplate each result as food for thought.
If you want the world’s worst swear word, you’ll have to create it yourself. Here you go:
Click the Go button repeatedly and contemplate each result as food for thought.
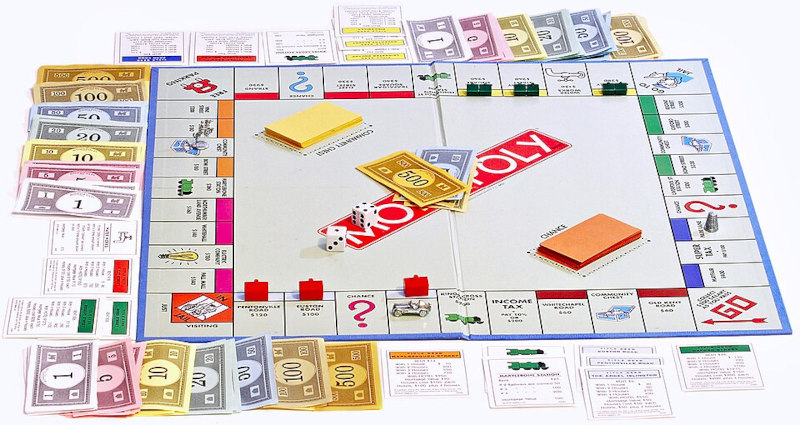
Parker Brothers have made more than 275 million copies of their Monopoly game. They have printed more Monopoly money than the US Federal Reserve has issued in real money for America. If you stacked up all the Monopoly sets they have made, the pile would be over 7,100 miles (11,400 km) tall, almost the diameter of Earth.
Here’s a deeper Analysis:
1. Printed Money Comparison: False (Misleading / Dependent on Definition)
2. Stacking the Monopoly Sets
Even if you stack only the folded game boards or measure a stack of roughly 50 million boxes, the height easily exceeds 1,100 miles (1,770 km).
If you placed all the Monopoly money ever printed end to end, it would circle the globe roughly 145 to 160 times (and up to 260+ times under higher production estimates).
For 300 Million Games (Standard Estimate):
For perspective, placing all those bills end-to-end wouldn’t just circle the Earth—it would reach the Moon and back about 8 to 13 times!

Windows 2000 (built on the NT architecture) was widely regarded by IT professionals as one of Microsoft’s most stable, secure, and reliable operating systems, especially compared to consumer-focused contemporaries like Windows 98 and Windows Me.
2. The Bug Count
Shortly before Windows 2000 shipped in February 2000, an internal memo was leaked. It was written by Microsoft software architect Marc Lucovsky. The memo revealed that the operating system contained over 63,000 potential known defects:
“BugBug” Comments: The memo noted over 27,000 developer comments tagged as “BugBug” (notes marking long-forgotten issues or work-in-progress code).
Automated Code Scan Results: Microsoft’s static analysis tool (PREfix) flagged over 65,000 potential issues, of which engineers estimated roughly 28,000 were likely “real” software bugs.
In the memo, Lucovsky famously urged developers to clean up the code, writing:
“How many of you would spend $500 on a piece of software with over 63,000 potential known defects?”
Context: Why So Many Bugs?
While 63,000 sounds alarming, software engineers noted that:
Scale of Code: Windows 2000 was massive for its time, containing roughly 29 to 35 million lines of code.
Rigorous Testing: Microsoft responded to the leaks by clarifying that the 63,000 figure was the result of exceptionally thorough internal testing and automated code analysis, capturing everything from minor cosmetic glitches to potential edge-case crashes.
Despite the leaked figure, Windows 2000 went on to become an industry workhorse renowned for its stability.
What about the current version of Windows? Microsoft doesn’t publish bug count, but you can bet there are some bugs, mostly harmless, of course. Whereas Windows 2000 consisted of approximately 30 million lines of code, Windows 11 is over 60,000 lines.
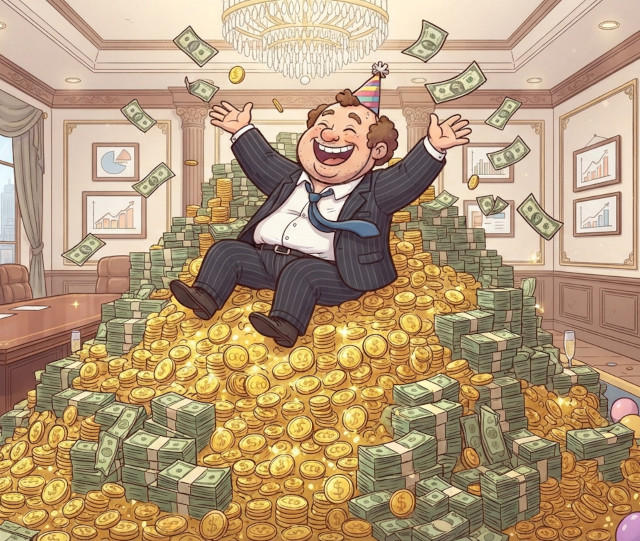
In Japanese corporations, the CEO (Chief Executive Officer) is paid an average of 45 times as much as the common workers. In America, the average CEO gets 300 times as much as the workers.
During difficult financial times, in companies that have to lay off 300 workers, perhaps they should fire the boss instead. I’m sure the 100 workers produce more profit and I think if they pooled their thoughts, they could run things at least 300 times better than the average American CEO. In fact, one good worker from the trenches might do a better job of decision-making, and he might be quite happy with a salary of only two or three times as much as he was getting.
Here are some specifics:
The Japanese Ratio:
For major publicly listed firms on the Tokyo Stock Exchange (TOPIX 100 / Nikkei 225), the median CEO-to-average worker pay ratio generally ranges between 30-to-1 and 60-to-1, depending on executive equity compensation.
Context: Japanese corporate culture historically emphasizes workplace solidarity, salary caps relative to line workers, and limited use of stock option packages. However, Japanese executive pay has risen in recent years as companies introduce more performance-based equity incentives to compete globally.
The American Ratio:
According to annual analyses by organizations like the Economic Policy Institute (EPI) and the AFL-CIO Executive Paywatch, the CEO-to-worker pay ratio for major public companies (such as the S&P 500 or top 350 U.S. firms) typically ranges between 270-to-1 and 320-to-1.
Historical Origins: A 100-to-1 ratio in the U.S. was common around 1990. In 1965, the U.S. ratio was roughly 21-to-1; by 1989, it reached ~60-to-1, and surpassed 100-to-1 during the mid-1990s before climbing to its current levels driven by large stock and option grants.

For the majority of workers, particularly in Western countries, being heavy or obese is associated with lower earnings (known in economics as the weight or obesity wage penalty), not higher ones.
Women: The effect is strongest and most consistent for women. Numerous studies demonstrate that heavier or obese women face a significant pay penalty compared to their slimmer peers. For example, highly educated or upper-white-collar obese women earn anywhere from 10% to 19% less than normal-weight women in similar positions.
Men: For men in white-collar or higher-education roles, obesity is also tied to lower earnings (around a 5% to 14% wage penalty). Across general populations, men’s weight often shows little impact or a very slight negative impact on pay compared to women.
2. The Niche Exception: Manual Labor & Blue-Collar Jobs
The only context where heavier workers occasionally earn slightly more than very thin workers involves specific physical industries:
Heavy Physical Labor: In certain manual labor, construction, or production roles, having higher body mass or physical stature can sometimes correlate with greater physical strength, leading to a small “weight premium” when compared specifically to underweight or very thin men.
Underweight Penalty: Studies often find a “thinness penalty” for men in blue-collar jobs, where being significantly underweight leads to lower wages due to perceived lower physical capacity.
Key Takeaway
Outside of physical, manual-labor jobs where raw strength plays a direct role, extensive research across economics and sociology shows that heavier individuals face measurable wage penalties and hiring bias—making the claim that heavy people earn more than slim people false as a general rule.
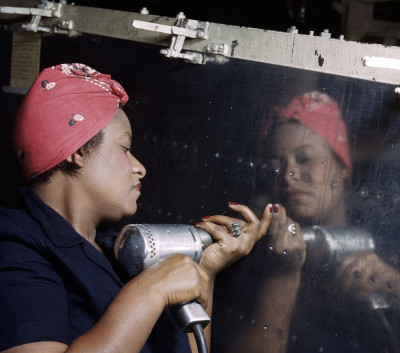
People who care about equality will often state that American women make 64 cents for every dollar a man earns. Is it true?
This claim is generally inaccurate for American women overall, but it is accurate for specific demographic groups.
According to data from the U.S. Census Bureau and the Bureau of Labor Statistics, the national gender wage gap is not as wide as 64 cents:
The 64-cent figure is often cited when discussing demographic breakdowns, specifically race and ethnicity:
Understanding how these statistics are calculated is crucial for context:
The US Navy set out to create an advanced, centralized computer network to automate inventory, supply chain management, and bookkeeping across its global fleet and shore stations.
Originally budgeted in the tens of millions of dollars (initial estimates for software and implementation were around $33 million), the project was plagued by severe technical flaws, poor management, hardware incompatibilities, and massive scope creep.
As costs skyrocketed past $200 million with little usable functionality delivered, Congress stepped in. The project was audited heavily by the General Accounting Office (GAO), and after spending roughly $230 million (the equivalent of over $1 billion today), the program was officially scrapped without ever becoming fully operational.
Defense critics and government oversight committees frequently cited the project as a textbook example of massive waste, concluding the military spent hundreds of millions of taxpayer dollars and walked away with nothing useful.
In a similar case, the United States Internal Revenue Service (IRS) spent $180 million just to decide if they should buy a $1.8 billion computerized tax return system. They decided no.
The IRS proposed TAS, a massive, centralized computer network designed to replace its aging computer hardware and give thousands of employees instant access to taxpayer files. The total projected cost to procure, install, and run the complete system was estimated at $1.8 billion.
Over several years of research, preliminary design, systems testing, and feasibility studies, the IRS and the Department of the Treasury spent approximately $180 million planning and preparing for the system.
The project faced intense backlash from Congress, the Office of Technology Assessment (OTA), and privacy advocates over fears of government surveillance, potential misuse of centralized taxpayer data, and astronomical cost overruns. Under heavy Congressional pressure and rising public opposition, the Treasury Department and the IRS officially canceled the project before the full system was ever purchased or deployed.

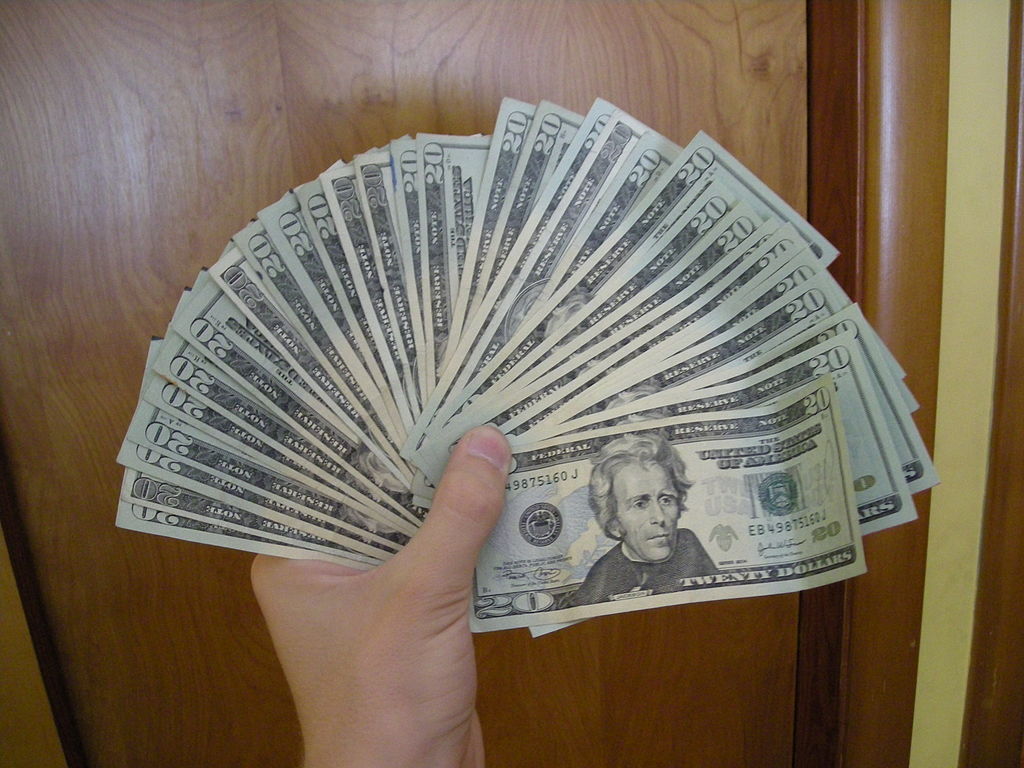
The average American spends more than a work week (40 hours) ever year waiting in lines.
There was a time when as much as one third of all the money in America was counterfeit.
President Abraham Lincoln authorized the creation of the Secret Service on April 14, 1865 (the day he was assassinated), and the agency officially was sworn in on July 5, 1865. Its original sole purpose was to suppress widespread currency counterfeiting.
Following the Civil War, financial systems were fragmented with thousands of different bank-issued notes in circulation, making forgery easy. Historical estimates from the U.S. Treasury indicate that between one-third and one-half of all paper currency in circulation at the time was counterfeit.
Counterfeiting remains an active crime, though modern digital printing methods and sophisticated security features (like 3D security ribbons and color-shifting ink) have shifted how it occurs.
Counterfeiters are still at it. The U.S. Secret Service and Federal Reserve seize tens of millions in counterfeit bills annually. Total global circulation of fake U.S. currency is estimated between $70 million and $100 million.
One of the ways the US Federal Reserve detects counterfeits is to check the iron content of the ink.

Here is a list of common fears:
Acrophobia – Fear of heights
Ailurophobia – Fear of cats
Arachnophobia – Fear of spiders
Ophidiophobia – Fear of snakes
Claustrophobia – Fear of confined spaces
Nyctophobia – Fear of the dark
Glossophobia – Fear of public speaking
Thanatophobia – Fear of death or dying
Trypophobia – Fear of clusters of small holes or bumps
Coulrophobia – Fear of clowns
Thalassophobia – Fear of deep bodies of water
Aviophobia – Fear of flying
Mysophobia – Fear of germs or dirt
Agoraphobia – Fear of open or crowded spaces
Hemophobia – Fear of blood
Dentophobia – Fear of dentists
Emetophobia – Fear of vomiting
Autophobia – Fear of being alone
Xenophobia – Fear of strangers or foreigners
Nosocomephobia – Fear of hospitals
Pyrophobia – Fear of fire
Taphophobia – Fear of being buried alive
Zoophobia – Fear of animals
Galeophobia – Fear of sharks
Atychiphobia – Fear of failure
Decidophobia – Fear of making decisions
Achluophobia – Fear of darkness
Entomophobia – Fear of insects
Phonophobia – Fear of loud noises
Cacophobia – Fear of ugliness or things perceived as ugly
Amaxophobia – Fear of driving or riding in a vehicle
Which one of these do you consider the worst fear?